Saturday, February 20, 2016

Video Analysis Blog Post


1. In this experiment, we learned the basics of shooting and analyzing a video containing a ball with upward and forward motion on PASCO Capstone. We began filming our video by putting a meter stick on the wall so the system would have a basis for measurement, and later analyzed it in the system. The video is below.


2. 

a. Below is a picture of the markings that represent the motion of the ball after it was passed, or the the ball’s ascending and descending motion. The marks were used to create the velocity-time and position-time graphs that will be displayed later.


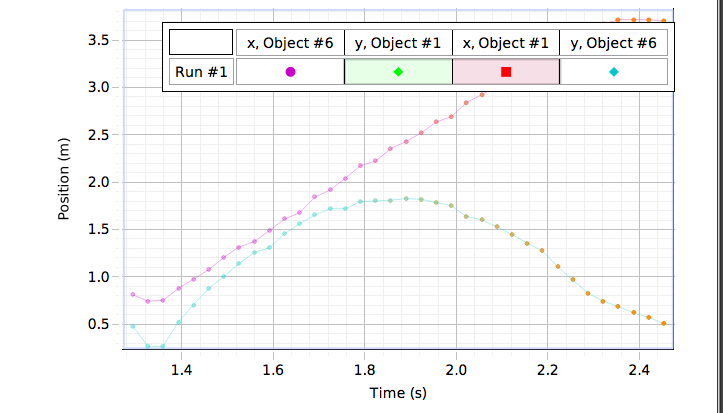
b. This position versus time graph represents the position of the ball in both the horizontal and vertical directions. The curved line represents the motion in the vertical direction. The ball moves upward at a constant velocity, passes through a velocity of 0m/s at the top of its path, then falls downward at a constant velocity. The straight diagonal line represents movement in the horizontal direction. It is straight because the ball was traveling at constant velocity moving forward in the horizontal direction.


c. This is the velocity versus time graph which also indicates motion in the horizontal and vertical directions. The blue line represents motion in the vertical direction. The line with a negative slope starts above the x axis which represents the ball slowing down as it reached the top of its path, and as it crosses the x axis and continues downward, it represents the ball speeding back up as it travels downwards into Dohee’s hands. 

3. Analysis

a. ACCELERATION IN THE Y (VERTICAL) DIRECTION: 9.88 m/s^2- This was found by simply finding the slope of the velocity time graph, and I know this is accurate because the acceleration for any falling object is always 9.8m/s^2 because it it the universal gravitational constant,  but for the sake of this class we round it up to 10. 9.88 is pretty accurate, and it is a negative because the slope of the line on the v-t graph is negative.

b. ACCELERATION IN THE X (HORIZONTAL) DIRECTION: 0 m/s^2- I know this to be true because the ball is traveling at a constant velocity (as indicated by the position time graph) because the forces are balanced in the horizontal direction, therefore, nothing is acting on it to cause acceleration

c. INITIAL VELOCITY IN X DIRECTION: -.87 m/s- I know this to be true because this is the y intercept for the orange line on the v-t graph which represents initial velocity in the horizontal direction

d. INITIAL VELOCITY IN Y DIRECTION: -3.24 m/s- I know this to be true because this is the y intercept for the blue line on the v-t graph. The y intercept represent the initial velocity in the vertical direction

e.VELOCITY AT THE TOP OF PATH IN HORIZONTAL DIRECTION: constant non zero velocity- I know this to be true because the ball is always moving at some given speed in the horizontal direction, but the acceleration at the top of the path in the horizontal direction is 0m/s^2, because once again, the forces are balanced in the horizontal direction 

f. VELOCITY AT THE TOP OF PATH IN VERTICAL DIRECTION: 0m/s- I know this is true because the ball temporarily stops at       the top of its path before it changes direction,but the acceleration is -10m/s^2, because that is always the accretion for anything that is falling

g. FINAL VELOCITY IN THE X DIRECTION: -.25 m/s- This is the final point on the v-t graph for the orange line

h.  FINAL VELOCITY IN THE Y DIRECTION: -1.74 m/s- This is the final point on the v-t graph for the blue line

i. HOW HIGH THE BALL GOT: 1.83 m- I found this by locating the highest point on the position time graph along the arc, which is movement in the vertical direction. This also can be found using the displacement formula, change in x= 1/2(a)t^2 +(vi)t. To solve for displacement, you would simply plug in the values from the graph including the acceleration, time, and initial velocity, and arrive at the same answer

j. HOW FAR THE BALL WENT: To find displacement, I used the formula xfinal-xinitial. According to the graph, the ball’s final position was .51 and the initial was .48, and according to the formula the ball traveled .03meters 

k. HOW MUCH TIME THE BALL TOOK TO GET TO THE TOP OF ITS PATH: 1.89 seconds- this is the x coordinate that matches with the highest point on the graph of 1.83m

l. HOW MUCH TIME THE BALL WAS IN THE AIR: 2.453 seconds- this is the final time according to the position time graph 

4. Conclusions

a. From this experiment, I can have learned that the acceleration in the vertical and horizontal directions are different despite my assumption that they will be related in some way. 

b.The vertical versus horizontal formulas for finding velocity are also different and must not be confused for one another or else the wrong answer will be found. In the horizontal direction, the formula to solve for velocity is v= change in position/change in time, but in the vertical direction, you have to manipulate the formula acceleration=change in velocity/ change in time to solve for velocity. 

c. The vertical versus horizontal formulas to solve for displacement are different as well. For the horizontal direction, you would use the formula displacement= final position-initial position, but for the vertical direction, you can either solve for the area under the line, or use the formula displacement=1/2(a)t^2+(vi)(t).

d. The vertical formula to solve for height is also 1/2(a)t^2+(vi)t

e. Staying true to the trend, the vertical versus horizontal velocities at the top of the ball’s path differ, as the velocity is 0m/s in the vertical direction because the ball goes through a brief period of rest, and it is at a constant non zero velocity in the horizontal direction because it is constantly moving forward.

To conclude, I have learned how distinct the horizontal and vertical directions are when it comes to motion and displacement, and there really isn’t any overlap when it comes to calculating certain values.


Friday, February 12, 2016

UFPM Cart Challenge

What we did: In this lab, our goal was to accurately predict the time it would take for the hanger on a modified Atwood machine to land on the top of a moving cart. Before making our predictions, we collected data that we would later compile together to make the final prediction. 


This is a picture of the cart on the track, the 500g weight we added to the top, and the hanger


This is the track the cart ran on


This is the cart the hanger would land on 


We started off drawing a free body diagram for the cart on the track to better understand what causes its motion. In this case, we assumed that friction was negligible, so the unbalanced force is in the direction of the tension exerted on the cart from the hanger. We were able to figure out the Fn and Fg’s of the cart (which are balanced), by weighing the cart and the hanger, and then adding the 500g weight that was placed on top. The reason why the cart and the hanger were both weighed is because we were trying to find the mass of the ENTIRE system, therefore everything needed to be weighed. The weigh in grams of the cart and hanger was 551.8g, and we added a 500g weight to the car. After adding the two together, we came up with 1051.8g. To convert to kilograms, we had to move the decimal 3 places to the left which gave us 1.051kg, and then we multiplied by 10 to get newtons, which is where we got 10.51N. 


As previously mentioned, the net force of the cart came from the hanger which was exerting tension. To find out the value of the tension, we weighed just the hanger and got 51.1g which is equal to .511N. 


After collecting the data for the cart on the track, we then moved on to the moving cart on the ground. We ran 4 trials with the motion sensor then averaged the values together to get an average velocity of .325m/s.

Velocity for Cart 2

Trial 1 .32 m/s
Trial 2 .34 m/s
Trial 3 .32 m/s
Trial 4 .32 m/s
AVG V .325 m/s


After finding the average velocity, we needed to solve for the acceleration of the cart which we would then use to calculate the time it should take for the hanger to hit the cart. To find acceleration, we had to use the formula a=Fnet/mass. As previously mentioned, the Fnet of the system was the tension, which was .511N, and the mass of the entire system is 1.051kg. After diving the two we got an acceleration of .486 m/s^2. 


We then used the formula: change in x(displacement)=1/2a(acceleration)t(time)^2+vi(initial velocity)t(time). We were solving for time, but in order to do that, we needed to first have the displacement of the cart on the track from its starting point to the distance it takes for the hanger to hit the top of the cart on the ground. Displacement is found using final position-initial position, so it’s initial position on the ramp was at 169 cm, and the final position was 98 cm. We subtracted the two and got a displacement of 71cm. With that value, we plugged it into the formula along with the acceleration and solved for time which came out to 1.7 seconds.


Now that we had solved for the time, we could use that to solve for the displacement of the cart on the ground. To solve, we used the formula: change in x(displacement)=v(velocity)(time)+xo (initial position). We used the average velocity, the time we just calculated, and 0 for the initial position and came out with .5525 m which is equal to 55.25cm, the distance from the hanger in which we would place the cart.i


RESULTS:

To actually test our predictions, we placed the cart 55.25cm from the location of the hanger temporarily suspended in the air. One person was in charge of releasing the cart on the track while the other person timed when the hanger hit. To avoid human error, we started the cart before the designated mark and began the timer when it crossed the 55.25 mark for more accurate data collection. We ran the test a few times and our calculations proved to be accurate. The hanger landed on the cart after 1.7 seconds, so we did not need to calculate percent error. Even though our predictions were correct, next time I will make sure of the preferences for rounding calculations like average velocity and acceleration. 


We measured the 55.25 cm from the point at which the hanger would hit the cart and then started the cart a little before that point

This is the hanger before the cart on the track was released

This is the hanger on the cart at the end of the experiment

Wednesday, February 10, 2016

UFPM Summary

Unbalanced Force Particle Model
In this unit, we summed up a lot of our previous knowledge on free body diagrams and forces and applied that knowledge as we dove deeper into the relationships between acceleration, mass, and force defined by Newton’s Second Law. Later on in the unit we also brought friction back into the picture as we refreshed our memories on how to use the formula and solve for certain variables. 

Elevator Lab

One of the first experiments of this unit was performed in an elevator as we tested the weight of one subject and how it fluctuates as the elevator speeds up or slows down. Each group used a scale and measured the weight of an individual throughout different stages of the elevator’s travel. The results of my group are listed below:  
Original weight: 121.4 lbs
At rest at the bottom: 121.4
Starting to go up: 134.6
Going up at constant speed: 121.6
Slowing to stop at the top: 112
Stopped at the top: 121.4
Starting to go down: 111.8
Going down at constant speed: 121.6
Slowing to stop at the bottom: 130.6

The data shows that the weight stayed constant when at rest and traveling at constant velocity. When starting to go up the weight increases, but then vastly decreases right before it comes to a stop. It is the opposite when going down, as it vastly decreases when first starting to accelerate downward, then increases when it slows to a stop. Through this experiment, we were able to learn that Fg, or force of gravity that the person exerts on the floor will always stay constant, but the force the floor exerts on the person varies which is what determines acceleration. If the elevator is accelerating upward, the Fn or normal force from the floor is greater, indicated by a longer force vector of normal force and shorter for Fg in a free body diagram. If the elevator is accelerating downward, the Fg is larger indicated by a longer vector for gravity. We also learned that accelerating upward can be viewed as a positive acceleration and accelerating downward can be viewed as a negative acceleration.

Skateboard Trials
Another introductory experiment we did to introduce us to this unit was our test runs on the skateboard. One person sat on the skateboard while another pulled them forward. We ran several trials on people of various weights to see the difference amounts of force that had to be applied to get the person to accelerate. We came to the conclusion that the greater the mass, the greater the force needed to accelerate the system, and the greater the force applied, the faster the acceleration. 


Newton’s Second Law Post Lab Questions and Important Rules for the Unit
After completing both the elevator and the skateboard tests, we were able to learn how the information was related using Newton’s 2nd Law. We also familiarized ourselves with many of the important terms and methods we would be using thought the unit which will be stated below and referenced throughout the rest of the blog. Other key points from outside of the post lab questions will also be listed below.

Newton’s 2nd Law:  ~therefore, the greater the force applied to the object, the faster it will accelerate, but the heavier the object is, the slower that acceleration will be

Net Force: the forces on the object that are responsible for accelerating the object, or the unbalanced force
~if a baby is sitting in a wagon and her mother is pulling the wagon (assuming there is no friction), the net force would be the amount of pull the mom applies to the wagon because the forces in the other directions are balanced


Formula for calculating acceleration:  a(acceleration)=F Net/mass(kg)
~when using this formula, remember that acceleration is found in meters per second squared or m/s^2, F Net is always and ONLY the forces that are accelerating the system, and mass is always found in kilograms, so conversion between newtons and kg is often needed {(kg)(10)=N}
~F Net is a special case because the “base form” for representing it is Fn+(-Fg) which is only used when the unbalanced force is in the vertical direction. Fg is described as being negative because it is pointing downward on a free body diagram. The same would apply for friction, because it is always opposing the direction of motion, is is indicated as negative, or away from the positive, which is the direction of motion. The best way to remember this is to make a key for oneself labeling the axes with positive and negatives that correlate with he forces.


If mass doubled- acceleration would be cut in half due to inverse proportions

If force doubled- acceleration would double due to direct proportions

F Net and acceleration are always in the same direction and are directly proportional, but any forces off the axis do not count as the Net Force

weight(Newtons)=(mass)(gravitational constant)
~EX: person weighs 11kg, the gravitational constant is 10, so the weight= (11kg)(10)=110N

Formula for friction: Ff=(Mk coefficient of friction)(Fn)
UFPM Worksheet 1+2: With these 2 worksheets, we started with the basics and calculated simple net force problems where we were asked to solve for just one element of the net force such as the FN with the given information using a free body diagram. The questions below are taken straight from worksheet 1.


As pictured above, the free body diagram was created with a slanted axis because it depicts a child going down a slide, pay special attention to the way in which the forces were labeled, either positive or negative. the 55 degree angle was placed in between Fg and Fgy as normal, and 35 degrees was placed next to it so they both add to equal a 90 degree angle. In this situation, we are assuming that Fgy and Fn are equal and opposite forces, therefore, the net force on the child will be the combination of the frictional force of 160N and the force from Fgx. Fgx was found using the cosine of 35 degrees, which gave a result of 245.74 N. As stated earlier, friction is negative because it opposes the direction of motion, so a positive 245.74N Fgx added with a negative Ff of 160 N {(245.74 +(-160)} gets the net force of 85.74 Newtons which accelerates the child.


When finding the acceleration, the formula a=fnet/mass is used. We previously solved for the Fnet above, so the 85.74 N can be plugged into the equation divided by the mass of the child which is 30 kg. REMEMBER TO USE KG, NOT NEWTONS!!! Divide the two and that is the acceleration.


Above is the FBD for the grocery bag. 20 kg is converted to 200N by multiplying by 10. We do not know what the Fn force is, but we are given the acceleration, so we can use the formula to solve for FN=n. 5 is set equal to Fn-200/20. Multiply both sides by 20 and then add 200 to get the Fn of 300N, which answers the question that the groceries will not stay in the bag if the maximum capacity it can carry is 250N. 


UFPM 3: In this worksheet, we brought back the formulas from the CAPM units to combine with out new study. These word problems involve collecting the data that was given and then picking the correct formula to use to solve for the necessary information. Below is a sample problem from the worksheet.

Below are the formulas we brought back from the previous unit:


As pictured, the variables given in the problem were listed out to the side along with a FBD to better illustrate the situation. The Fnet was used to solve for acceleration which was then used in another equation along with the other variables to solve for displacement. 


UFPM Worksheet 4: This worksheet was quite similar to worksheet 3, but there was a lot more with correctly placing angles in the FBD. 


In the diagram above, a person is shown applying a horizontal force to the box. When drawing the FBD, the angle is placed opposite to the 20 degree angle, otherwise known as vertical angles in geometry, this is indicated in purple pen. 


Below are two more examples of properly placing angles in FBD’s.


UFPM Worksheet 5: In this worksheet we began to use friction and the coefficient of friction to solve problems. 


Pictured above, a free body diagram is illustrated, and the coefficient of friction is given so friction can be solved for. .15 is multiplied by the Fn of 500, and Ff came out to be 75 N which was then made negative on the FBD. 


Acceleration was then calculated in the same way with net force over mass.


Atwood Machines: When solving with Atwood machines, there are a few things to keep in mind. 

When solving for acceleration, the net force is the tension pulling the system, or all the forces combined depending on if it is a modified Atwood machine or a regular one. 

Modified: a=Fnet/mass

a= 20N (because that is the weight of the hanger)/5 kg (because this is the weight of the whole system)


Real: 


a=30N (because both sides are acceleration)/7 kg (because this is the mass of the whole system)